about-lbis-header

Laboratory & Material Testing

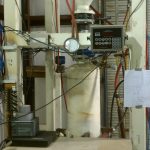
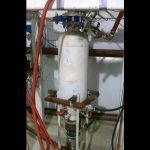
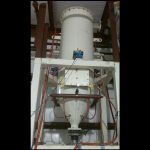
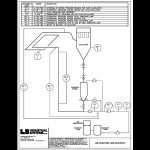
LBIS maintains a pneumatic conveying laboratory where we perform various bench-scale tests, and operate a pneumatic conveying test loop. The test loop includes a filter/receiver, pressure vessel, two-inch bore piping, and a high-pressure air supply. It is fully instrumented and equipped with data logging equipment. We perform conveying tests at various air and material flow rates, then scale up the data to predict performance in full-sized plant systems. We have field verified the performance of the completed full-sized systems on a number of occasions.

LBIS also works with equipment manufacturers to size and predict the performance of their equipment. For example; classification tests verify expected to yield at various feed rates and cut points.

Knowledge of certain physical properties of a material is important to understand it’s expected conveying, processing, and storage behavior in your plant. Standard tests are performed on the material to determine its properties and the results are compared to a database of known materials whose properties and conveying / handling behaviors are known. The comparison yields expectations about the conveying and handling characteristics of the subject material. This is called “Material Characterization”.

Some tests provide data for direct calculation of equipment sizing. Other tests provide data for comparison with similar materials whose performance is known.

Typical tests include:

  • Laser Diffraction Analysis
  • Sieve Analysis
  • LOI
  • Bulk Density
  • Particle Density
  • Angle of Repose
  • Pick Up Velocity
  • Permeability
  • Deaeration

Angle of repose and Bulk Density (aerated, poured and vibrated) are important for design of mechanical conveying and storage systems. Pick up velocity is used in the design of dilute phase pneumatic conveying systems.

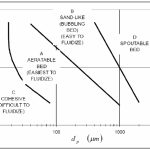
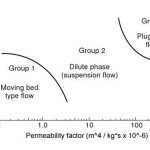
Two common tools used to assess the pneumatic conveying behavior of materials are the Geldart Classification Chart and the Pneumatic Conveying Product Classification Graph.

Mean particle size is plotted against particle density minus conveying air density to determine its Geldart classification. Geldart classifies materials as A (aeratable bed), B (bubbling bed), C (cohesive), or D (spoutable bed) according to their generally expected fluidization and conveying characteristics.

The permeability factor is plotted versus vibrated de-aeration rate constant on a pneumatic conveying product classification graph. This graph illustrates how material is conveyed based on the material characteristic to be aerated, and then hold its air. Materials are classified as suitable for: Group1 – Moving Bed Type; Group 2 – Dilute Phase; or Group 3 – Plug Type Flow.

Efficient Pneumatic Conveying Dense Phase vs. Dilute Phase: How being Accurate is More Cost Effective Than Being Conservative


    GET AN ESTIMATE!
    ';